Gender diversity
the past two decades
at the Massachusetts Institute of Technology

In the interactive map below, we show the incredible gender diversity in undergraduate classes across the Massachusetts Institute of Technology (MIT), on a class-by-class basis.

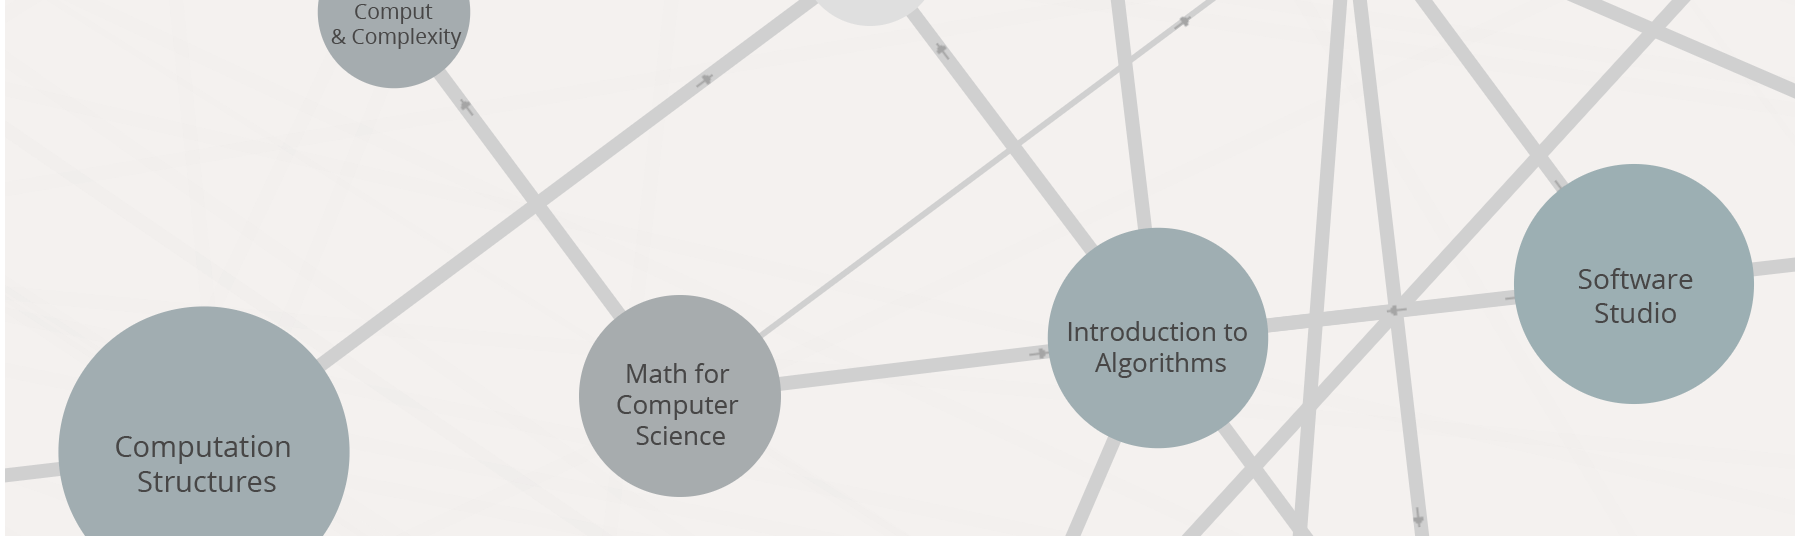
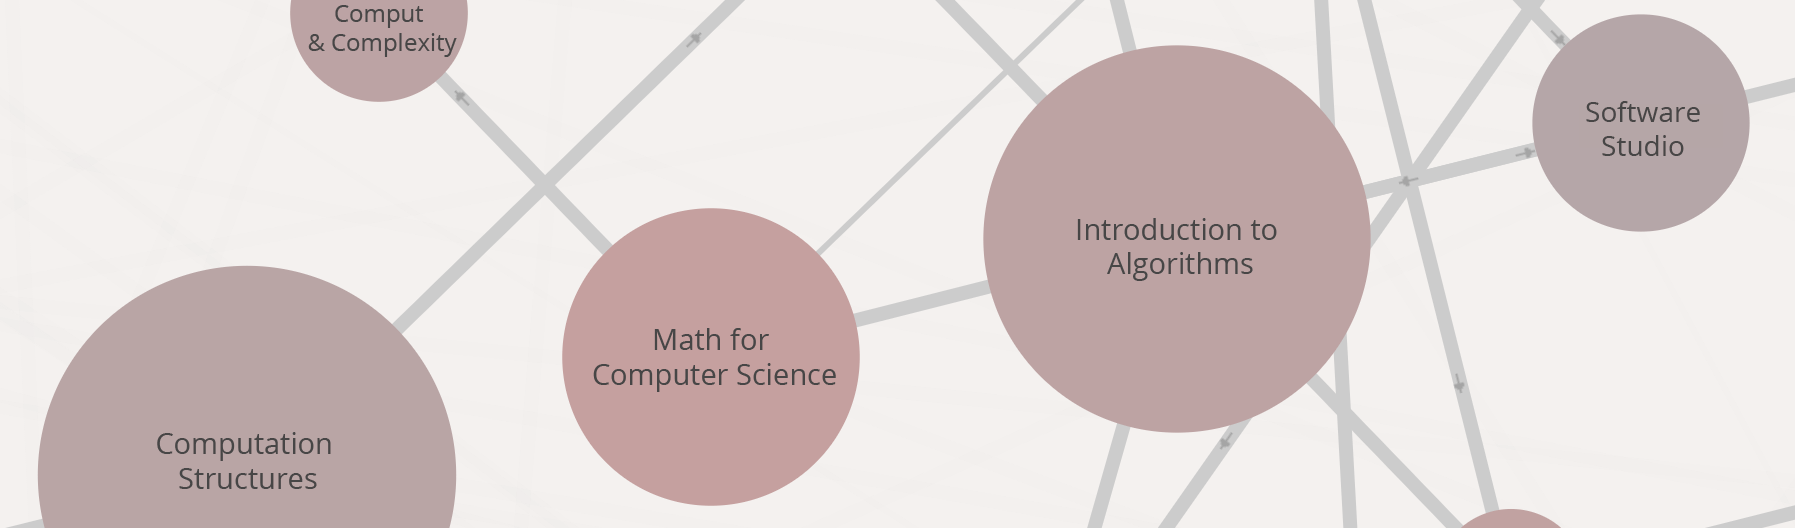
Each node (circle) on the map is an undergraduate class offered in the 2016 academic year.

The size of the node indicates total class enrollment size.

The color of the node indicates the percentage of women enrolled in the class.

Links between classes indicate pre-requisite and co-requisite relationships.

Fewer women enrolled

More women enrolled

MIT in 2016

MIT's undergraduate population has nearly 50% female enrollment, and has seen sustained gender diversity across departments and schools.

Click to see full map (new tab)

Pan the map to explore class data and departments across MIT.

Zoom to get a closer look at the gender diversity within a class cluster.

Click on a node to see the details of a particular class.

Search on a keyword to see how gender varies in similar subject areas across the Institute.

How has diversity changed over two decades?

The snapshots below capture the changing story of MIT's gender diversity over the past two decades. The maps show gender data (node color) and enrollment size (node size) for classes in the current MIT undergraduate curriculum that were taught in 1996 and/or 2006. Grey nodes are 2016 classes that do not exist in the historical data sets.

A slice across EECS in 2006

The same slice in 2016

Which classes had the most change from 1996 to 2016?

In the maps below, each class node is colored to show the change relative to 2016 in female percentage enrollment for MIT undergraduate classes. Pan, zoom and search the map to explore how diversity has changed across classes and departments from 1996 to 2016 and from 2006 to 2016.

Decrease in female enrollment

Increase in female enrollment

From 2006 – 2016

The decade from 2006 to 2016 has seen a notable increase in female enrollment in classes offered in departments across the School of Engineering.

Click to see full map (new tab)

From 1996 – 2006

The two decades from 1996 have seen more female students in classes across the Institute. In the large General Institute Requirement classes, these increases reflect the growth in MIT's overall undergraduate gender diversity.

Click to see full map (new tab)

Gender diversity in
MIT’s introductory Computer Science classes

The past few years have seen increased concern nationwide over the lack of gender diversity in computer science. Here we take a look at the past two decades of enrollment in MIT’s introductory computer science classes. For context we show the changing demographics of computer science majors. Our analysis at the level of individual classes goes beyond just trends in majors – it yields insights into the exposure of MIT undergraduate students to computer science classes more broadly.

MIT’s Department of Electrical Engineering and Computer Science (EECS, “Course 6”) has seen a steady increase in total female majors over the past six years. Since 2011 the proportion of female majors has increased from 30% to 38%. From 2004-2011 female enrollment was steady at around 200, but has more than doubled from that level to 493 in 2017.

Course 6 gender percent Course 6 gender percent

Over this time period the EECS department offered four different majors: Electrical Science and Engineering (Course 6-1), Electrical Engineering & Computer Science (Course 6-2), Computer Science and Engineering (Course 6-3), and Computer Science and Molecular Biology (Course 6-7, launched in 2012). Most of the increase in female major enrollment comes from Course 6-3. Female enrollment in Computer Science and Engineering has nearly tripled since 2011, from 88 to 258, while male enrollment has grown by 130% from 172 to 409 in the same time period. These changes took place under the leadership of Professor Anantha Chandrakasan, head of EECS from 2011 to 2017.

Course 6 gender percent

Introductory CS classes start to see a marked increase in female enrollment after curriculum changes in 2008. The new classes 6.006 (Introduction to Algorithms), 6.01 (Introduction to EECS), and 6.005 (Software Construction) were designed to reflect more modern content and modern pedagogy.

Course 6 gender percent

Introductory programming classes have consistently seen high female enrollment over the past two decades, with the proportion of women far outstripping the proportion in CS majors. In part this disparity can be explained by other MIT majors that require these programming classes, but there is also some indication that male students are more likely to skip introductory classes (which may be due to better preparation in high school or to higher self-confidence).

MIT’s mechanical engineering majors near gender parity

Nationwide, the fraction of bachelor's degrees in mechanical engineering earned by females is less than 15% (13.2% in 2015 according to the American Society for Engineering Education), yet MIT’s Department of Mechanical Engineering has seen sustained female major enrollments of more than 40% over the past five years.

Course 2 gender percent

The MIT Department of Mechanical Engineering offers two undergraduate majors: a traditional mechanical engineering degree (Course 2) and a flexible mechanical engineering degree (Course 2-A).

A recently published study analyzes the reasons for this. It is interesting to note that, similar to the EECS departmental data above, the number of female students increased markedly following major curriculum revisions in the mechanical engineering curriculum. This again suggests that in attracting increased numbers of women, it is important for a curriculum to be modernized in both content and pedagogy. It is also notable that the most rapid period of growth in female students coincides with the department’s first female head (Professor Mary Boyce from 2008 to 2013).